Dashboard and analytics
All your numbers on one screen
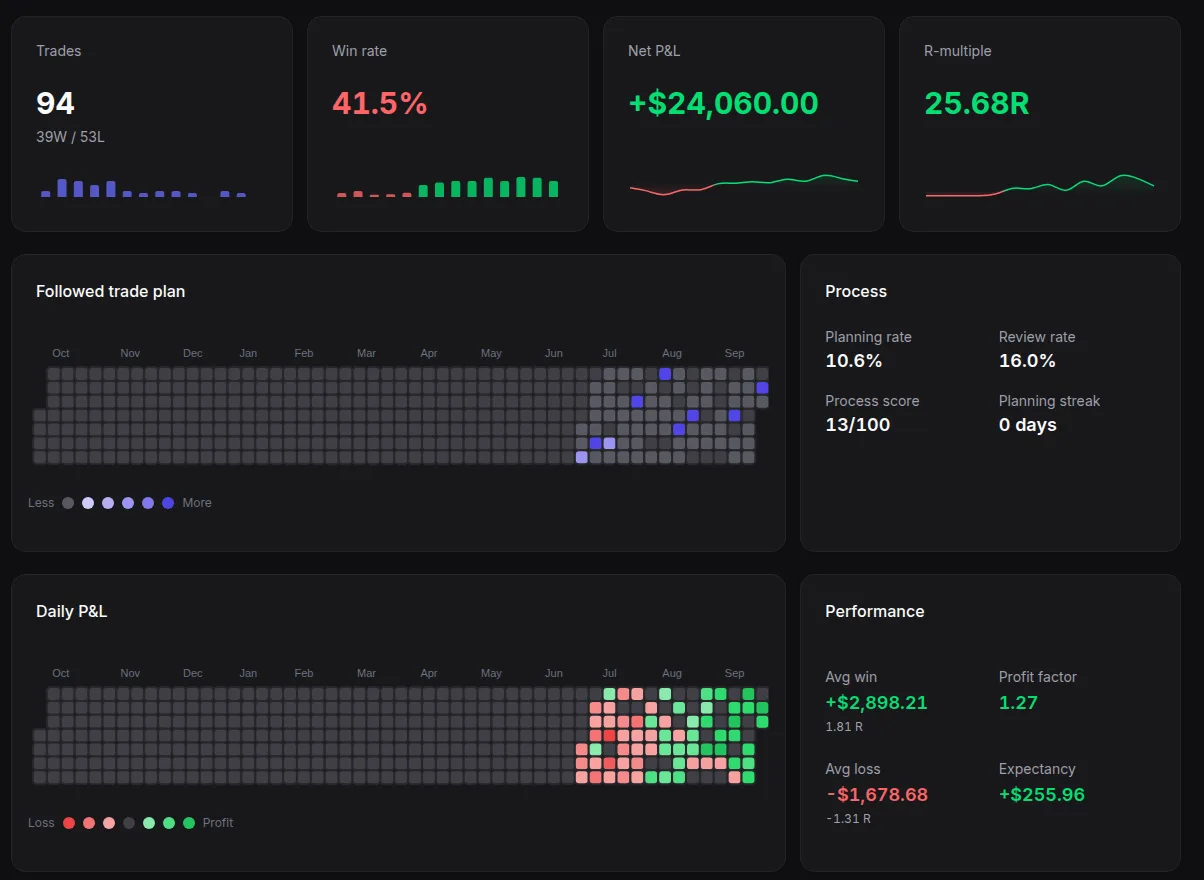
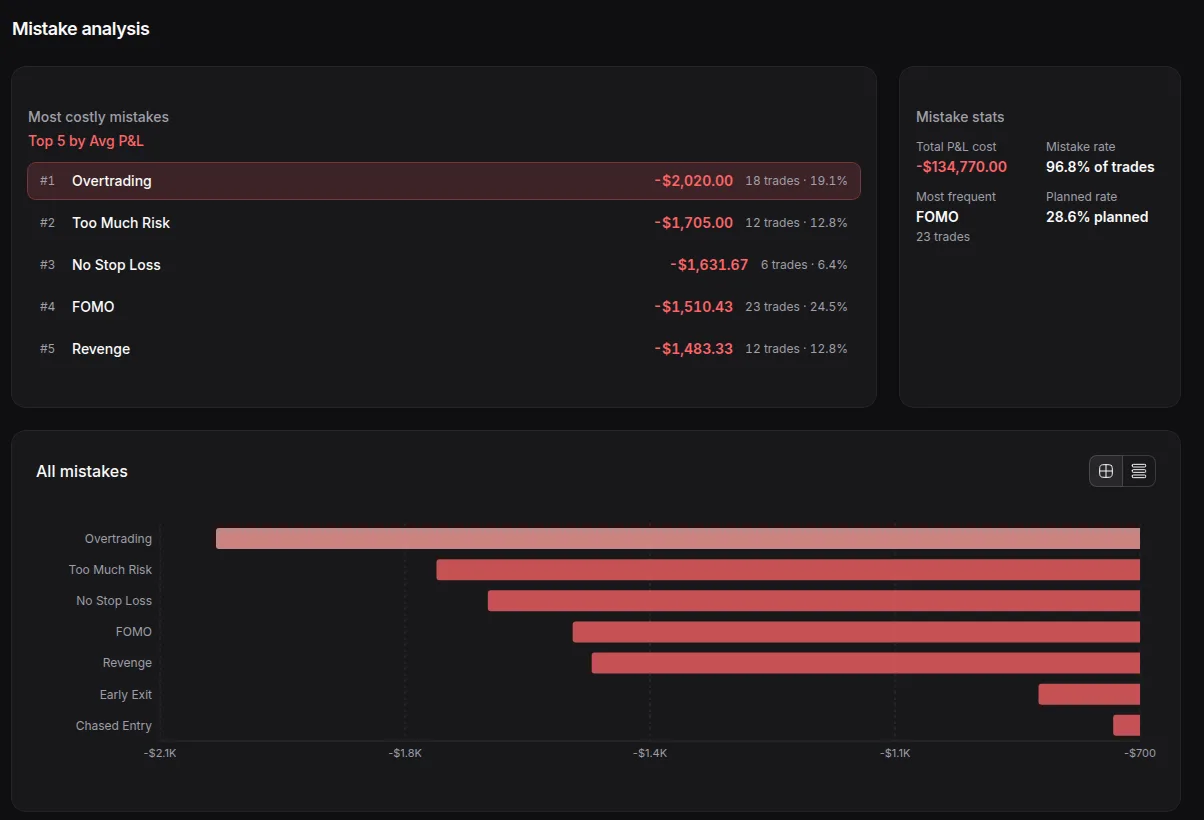
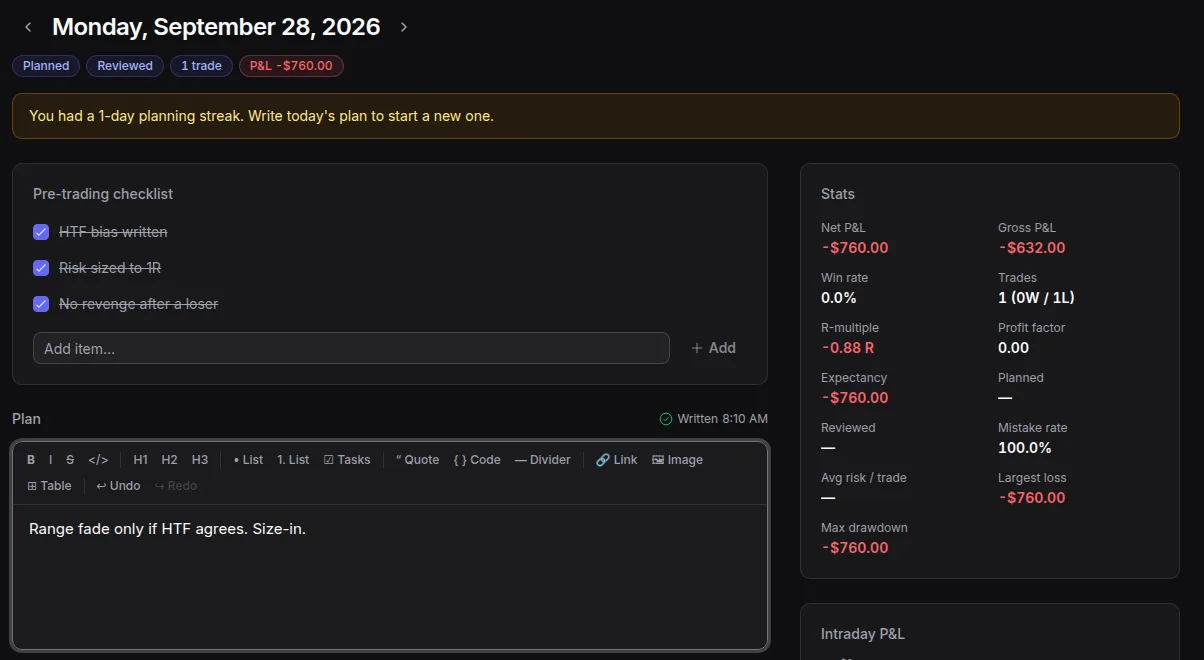
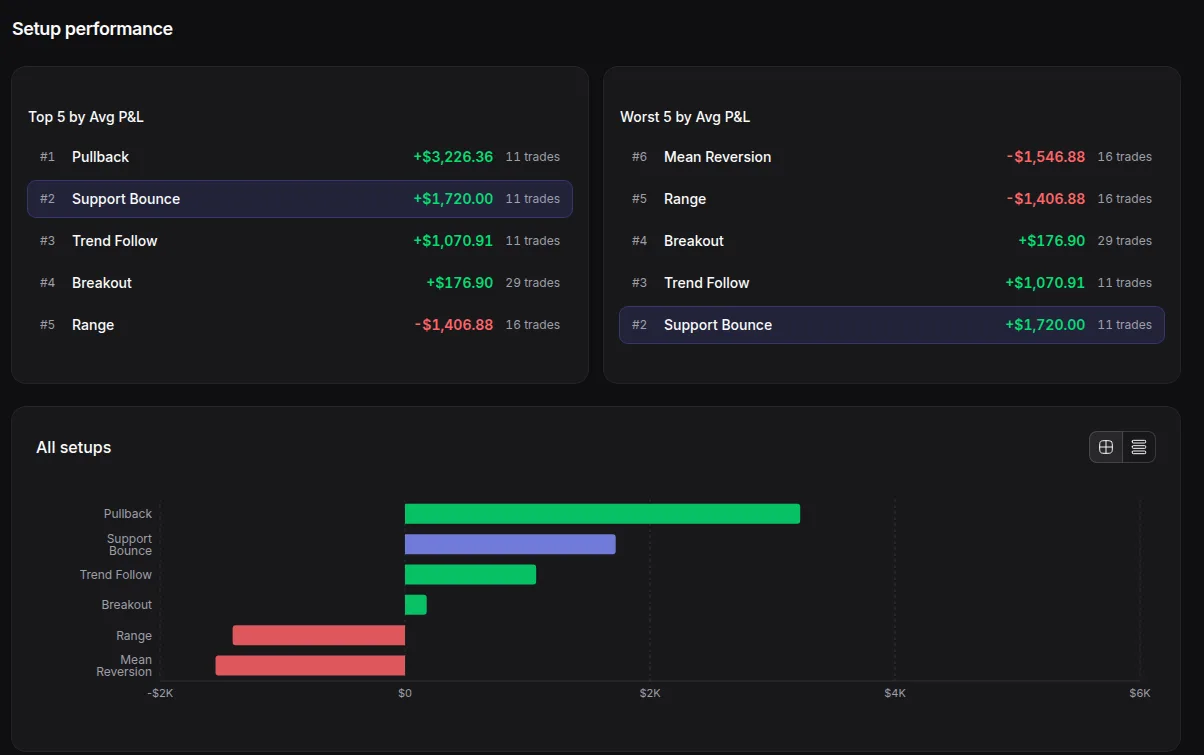
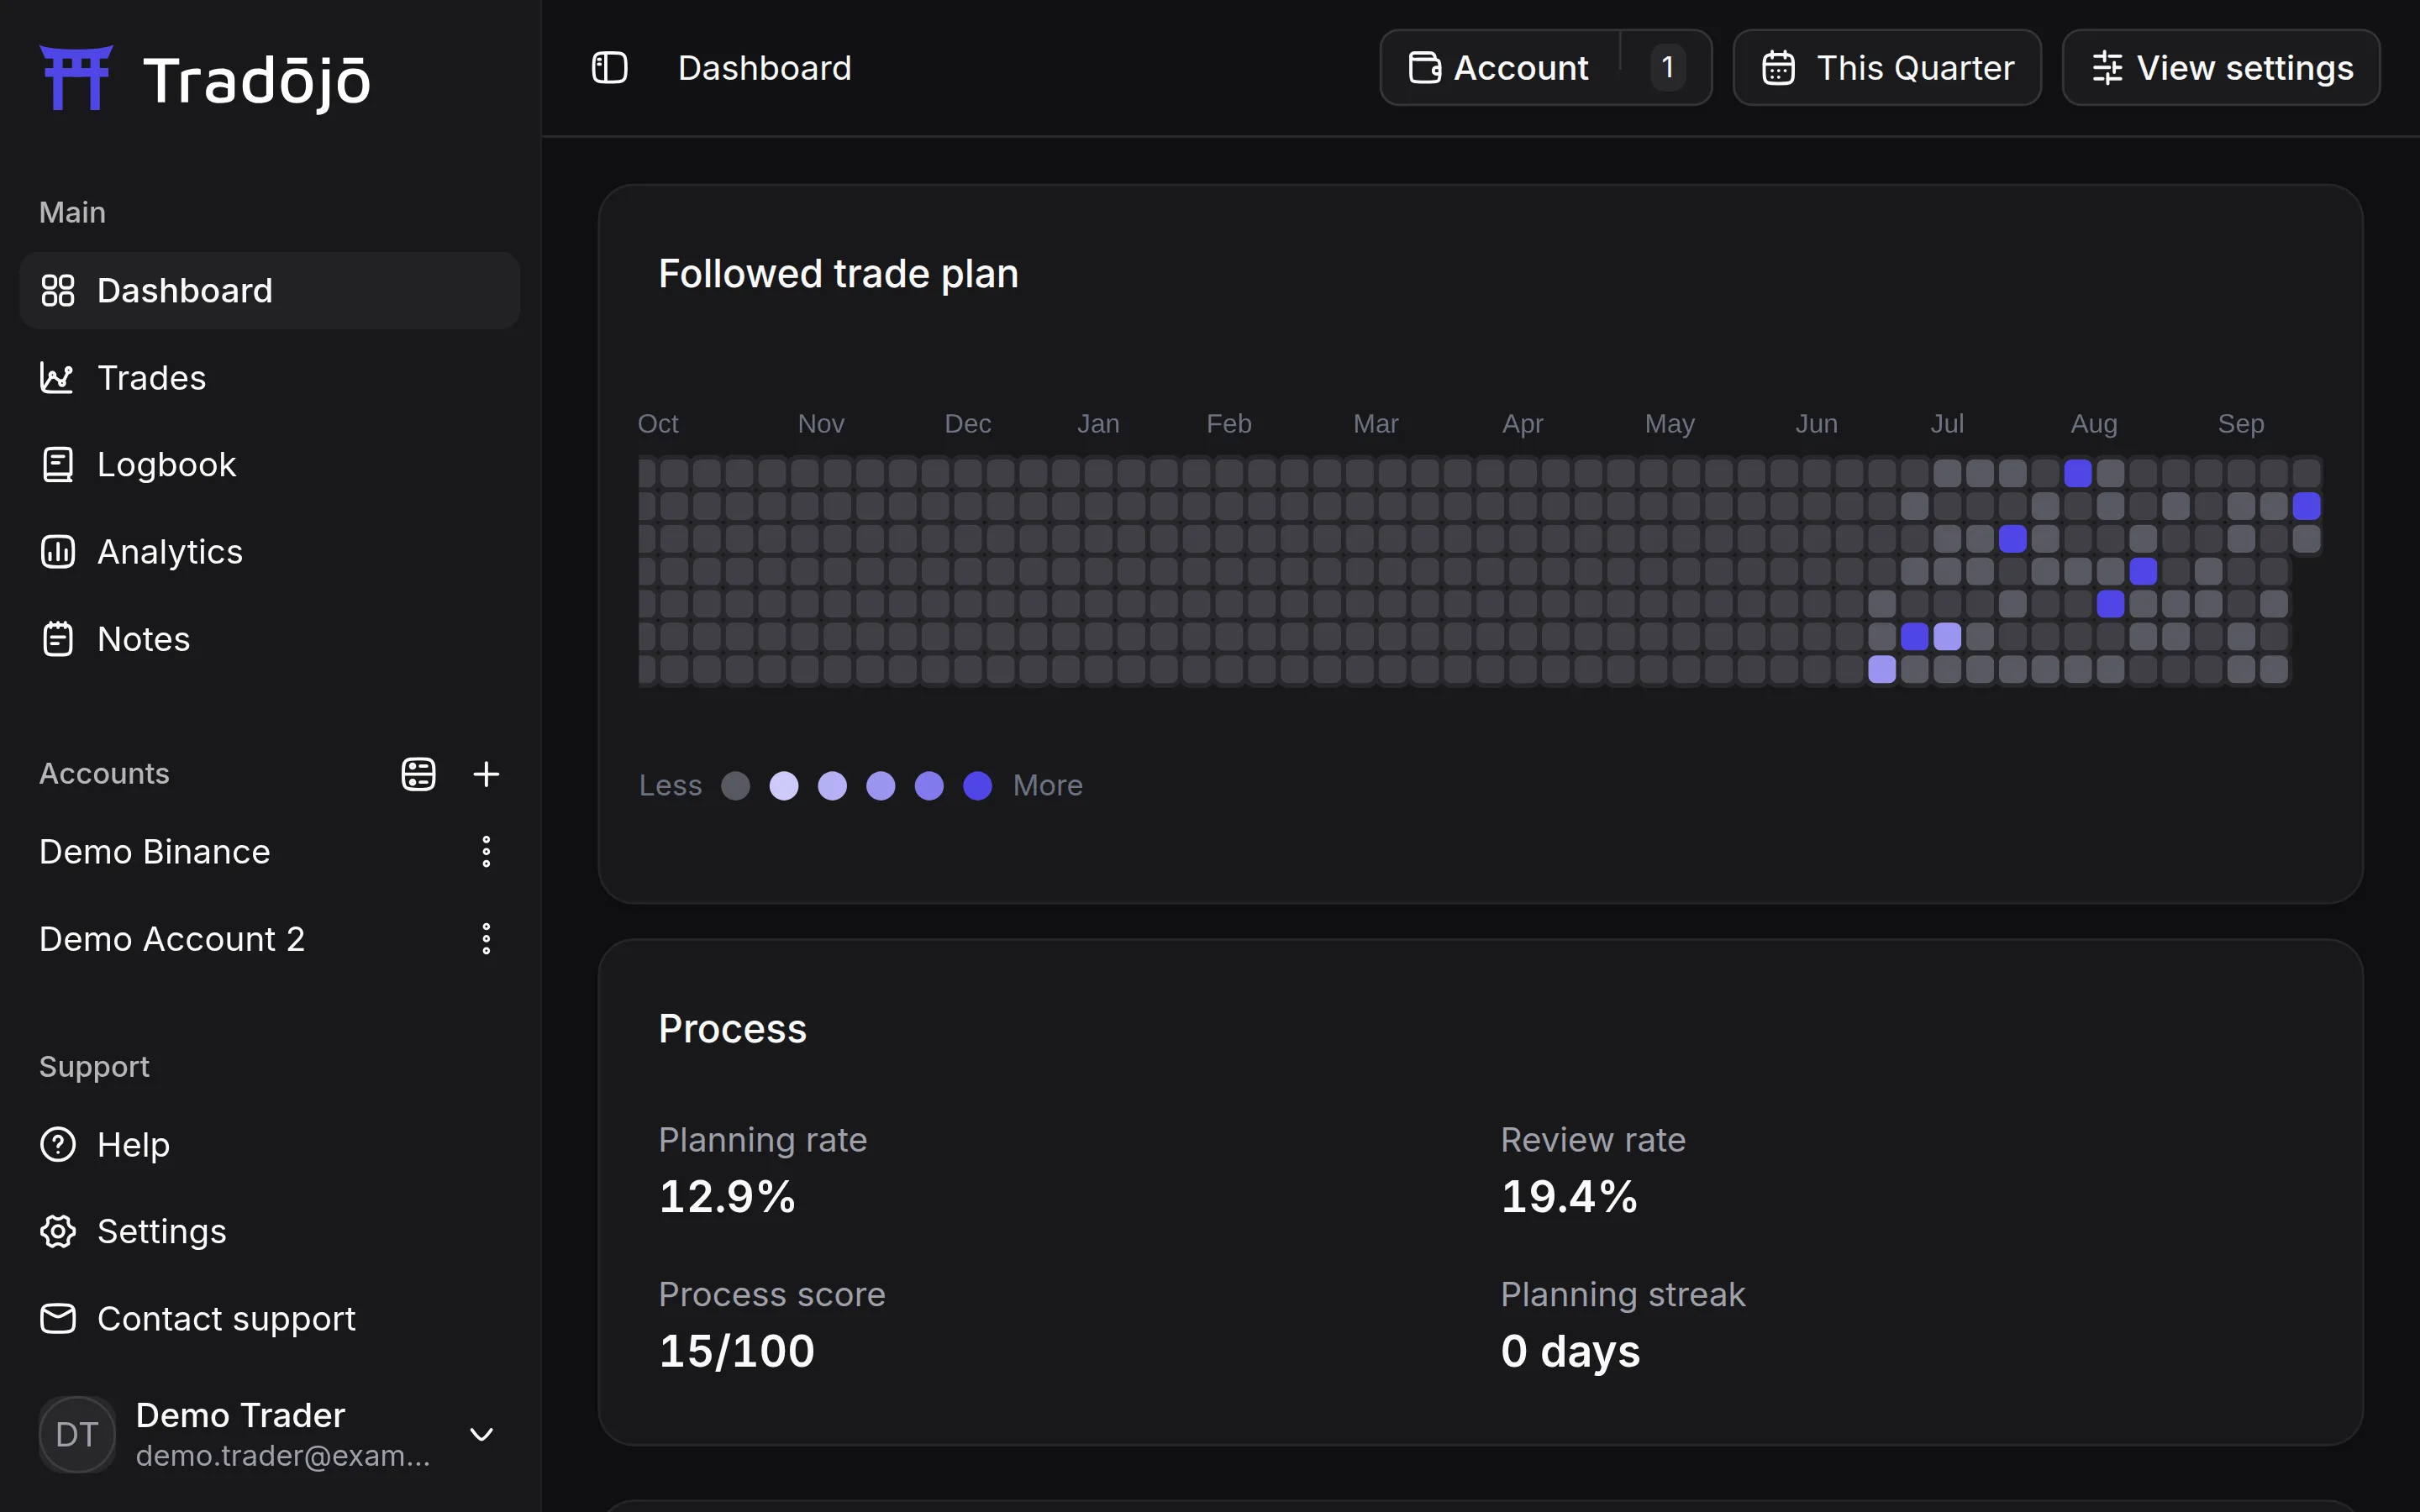
The dashboard shows Win rate, Net P&L, R-multiple, Avg win, Avg loss, Profit factor and Expectancy for the account and date range you pick. A heatmap shows your daily P&L, and the cumulative P&L chart shows the whole run. See how many of your trades you planned and reviewed, and keep the chain going. Analytics breaks results down by setup, mistake, tag, symbol, time and risk.
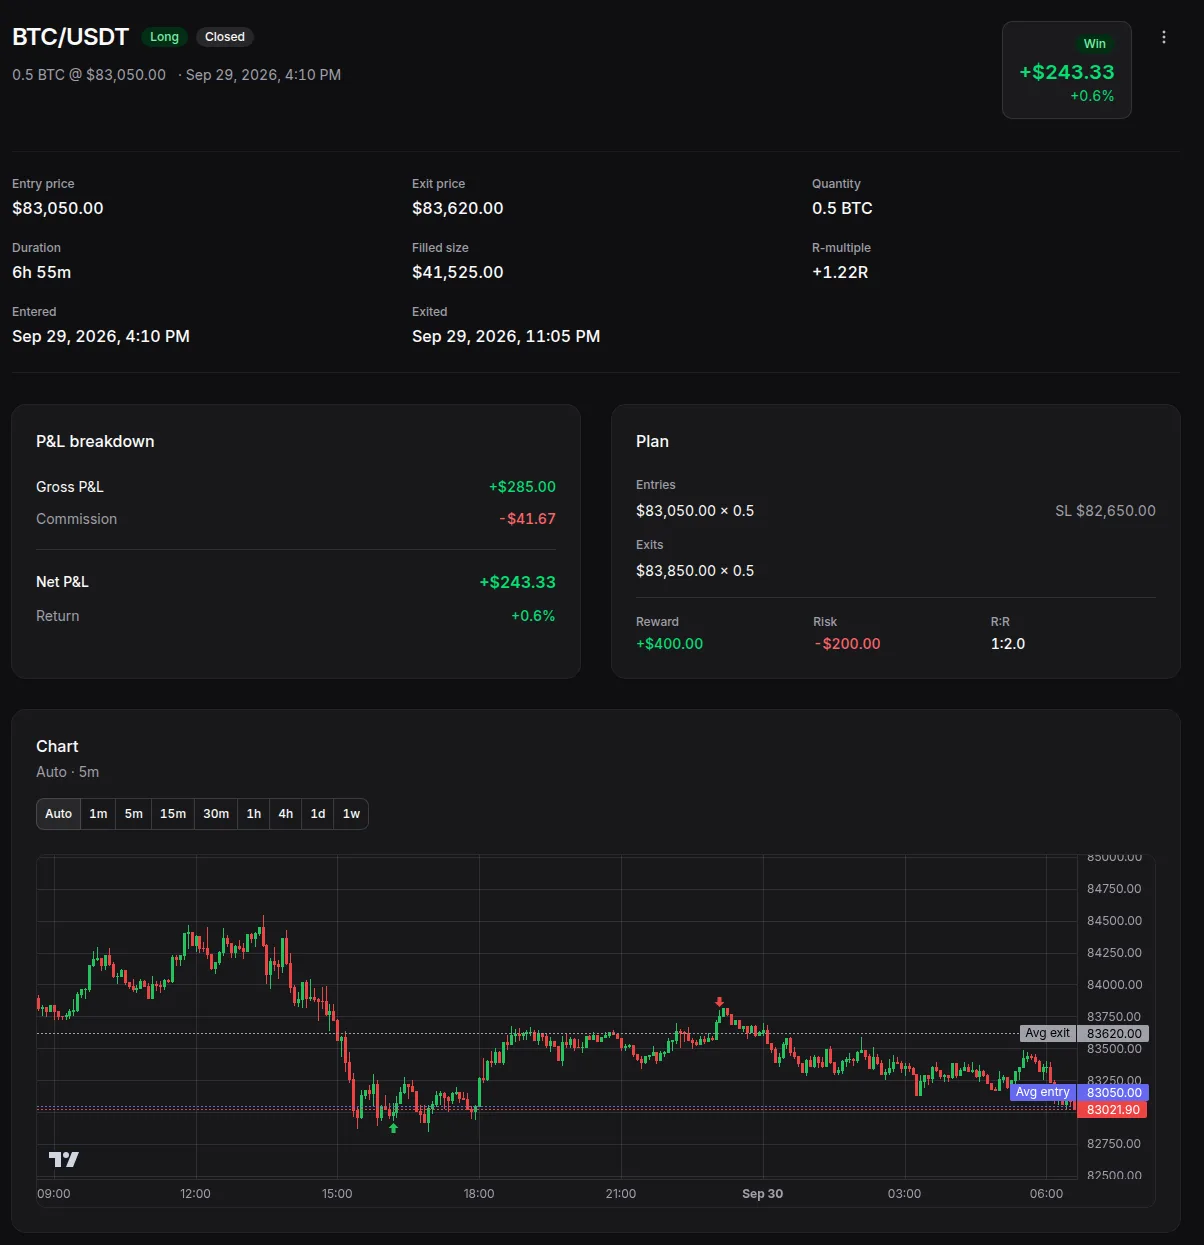
- Net of costs. Net P&L counts commission and funding fees.
- Break-evens counted separately. A trade that closes at exactly $0 net P&L is shown as break-even (e.g. 39W / 53L / 2BE), and Win rate counts it as a non-win.
- Time breakdowns. Results by weekday, hour of day and trade duration.